Overview
Codebase Insights Visualization for VSCode
Almost every professional programmer knows the struggle of trying to understand another person's code when joining a new project. The computer seems to know everything, but it can't tell you which files bugs or architecture problems lurk in. Why can't the computer help you?
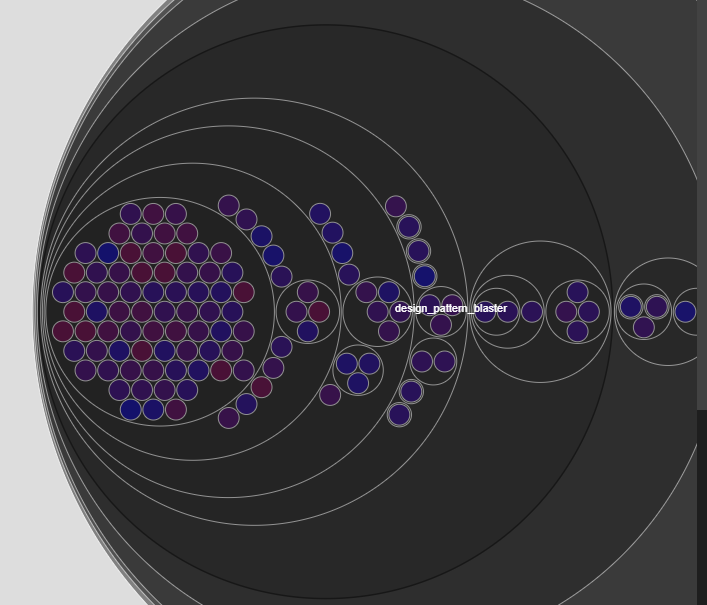
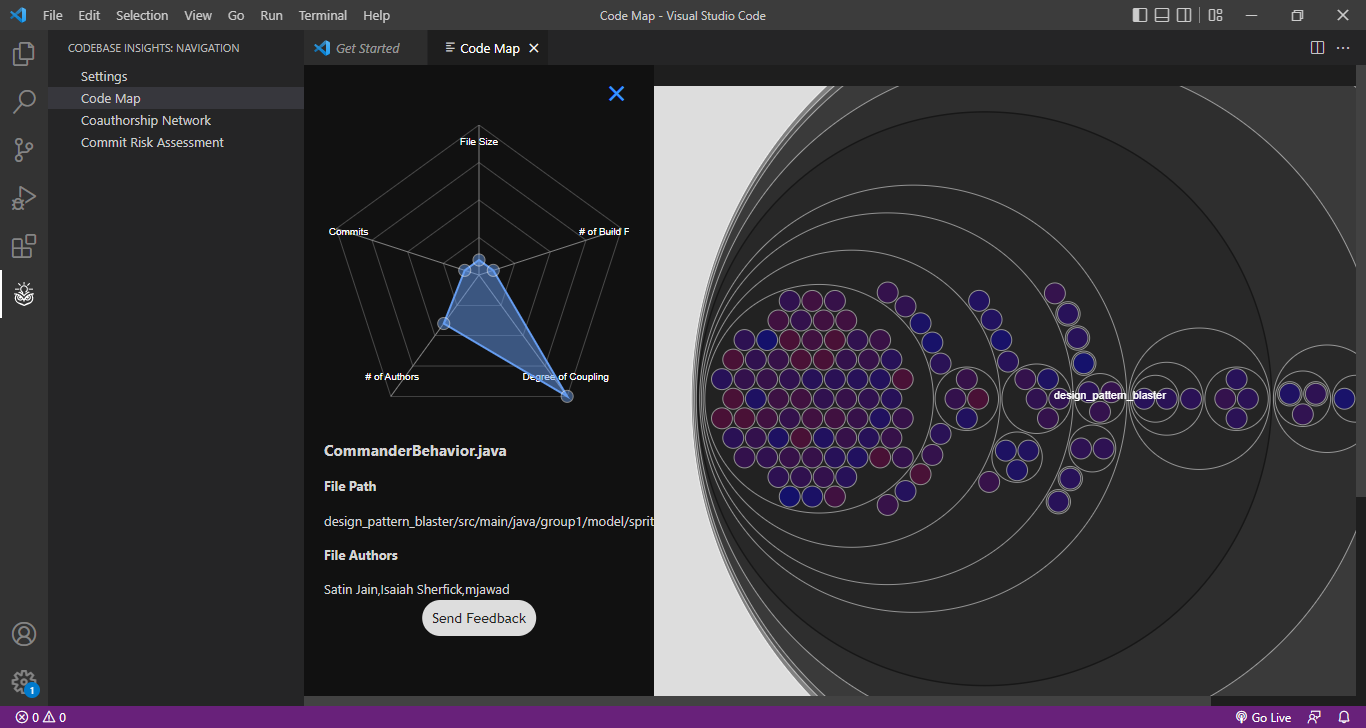
In Spring 2022, I developed a plugin for IntelliJ IDE that provides a visualization of a codebase to idenitfy the architecture "hot-spots." Every file is displayed with a "heat color" to identify the potentially problematic files in a project according to its commit history, number of authors, and file size.
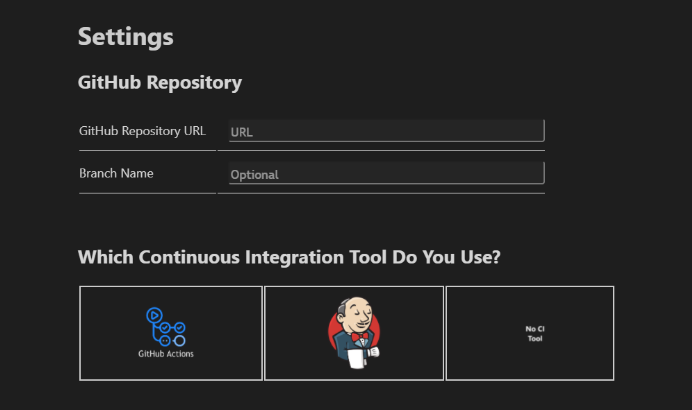
For example, a file that developers continue to make commits to long after the file was originally written is a warning sign for the architecture of that file. We also offer the capability to group files based on how often they appear in together in the same commit so that a hot file may tell a user to refactor that file or be aware of changes they need to make in other files in order to update one particular file. We analyze GitHub commits and, optionally, either Jenkins or GitHub Actions CI data to provide this data.
Our plugin is available for download on the VSCode Extension Marketplace. Just search "Codebase Insights" and look for the owl logo.
Gallery
Responsibilities
- Developed Spring Boot back-end
- Created all request endpoints
- Designed codebase analysis algorithms
- Deployed back-end to Heroku
- Linked project to a MongoDB database
- Front-end support
- Created Settings tab
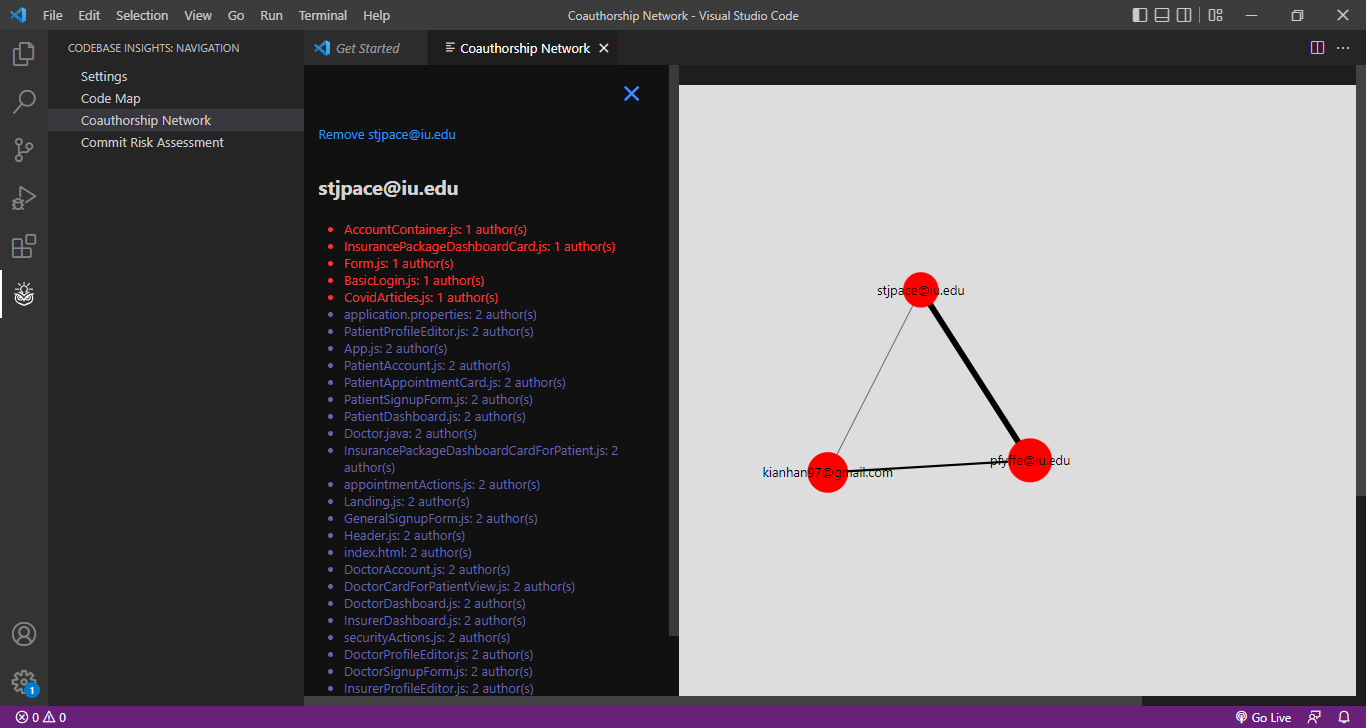
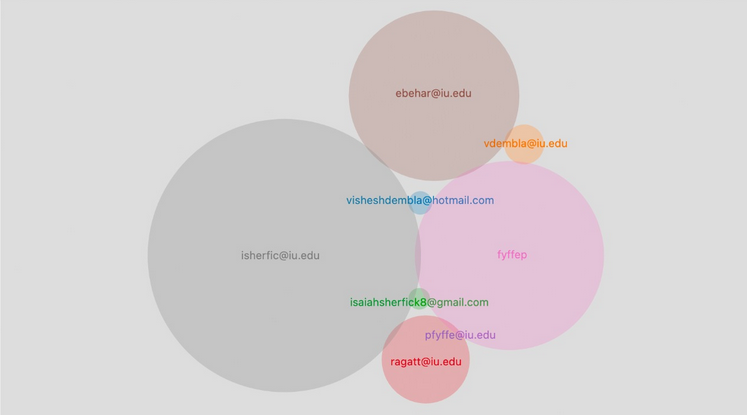
- Implemented Co-Authorship Network
- Led demos to glean feedback from our customers
Features
- Each file is given a heat color based on either:
- Number of commits
- Number of authors
- File size
- Degree of coupling (how often it is committed with related files)
- Number of build failures
- Overall (weighted total of all the above metrics)
- Drag the radar chart points then Submit Feedback to tell us which metrics were ranked inaccurately
- In the future, this data could be fed into a machine learning algorithm to enhance the accuracy of the analysis algorithms
- Shows amount of shared knowledge between authors as edges in a graph
- Provides a list of files known by each author
- Files are ranked and colorized by bus factor
- Based on the files you've modified...
- Provides heat metrics of those files
- Recommends changes to tighly-coupled files
Code Map
Co-Authorship Network
Commit Risk Assessment
Tech Stack
Technologies
- Spring Boot
- TypeScript
- VSCode Extension API
- MongoDB
Tools
- GitHub
- GitHub Actions
- GitHub Issues
- JUnit
- Jenkins API
- Heroku
- SonarQube
View the IntelliJ Version
View Another Project