Overview
Codebase Insights Visualization for IntelliJ IDE
Almost every professional programmer knows the struggle of trying to understand another person's code when joining a new project.
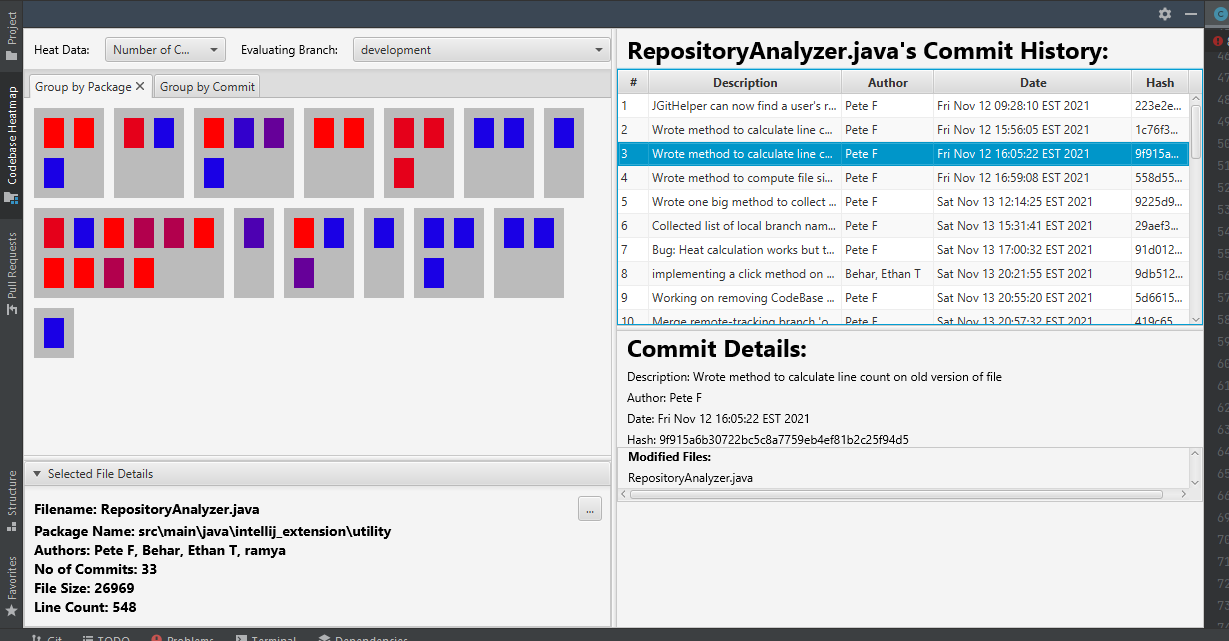
In Nov-Dec. 2021, my team and I developed a plugin for IntelliJ IDE that provides a visualization of a codebase to idenitfy the architecture "hot-spots." Every file is displayed with a "heat color" to identify the potentially problematic files in a project according to its commit history, number of authors, and file size, which my team and I collect from GitHub.
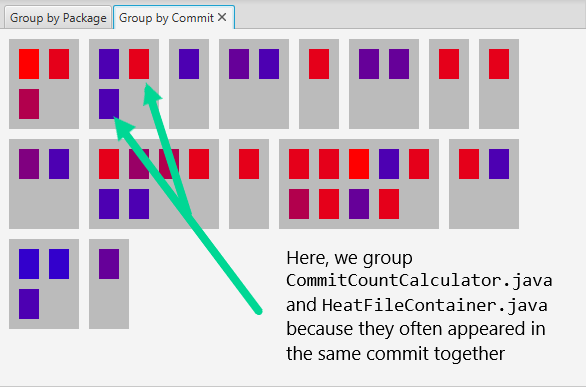
For example, a file that developers continue to make commits to long after the file was originally written is a warning sign for the architecture of that file. We also offer the capability to group files based on how often they appear in together in the same commit so that a hot file may tell a user to refactor that file or be aware of changes they need to make in other files in order to update one particular file.
Gallery
Features
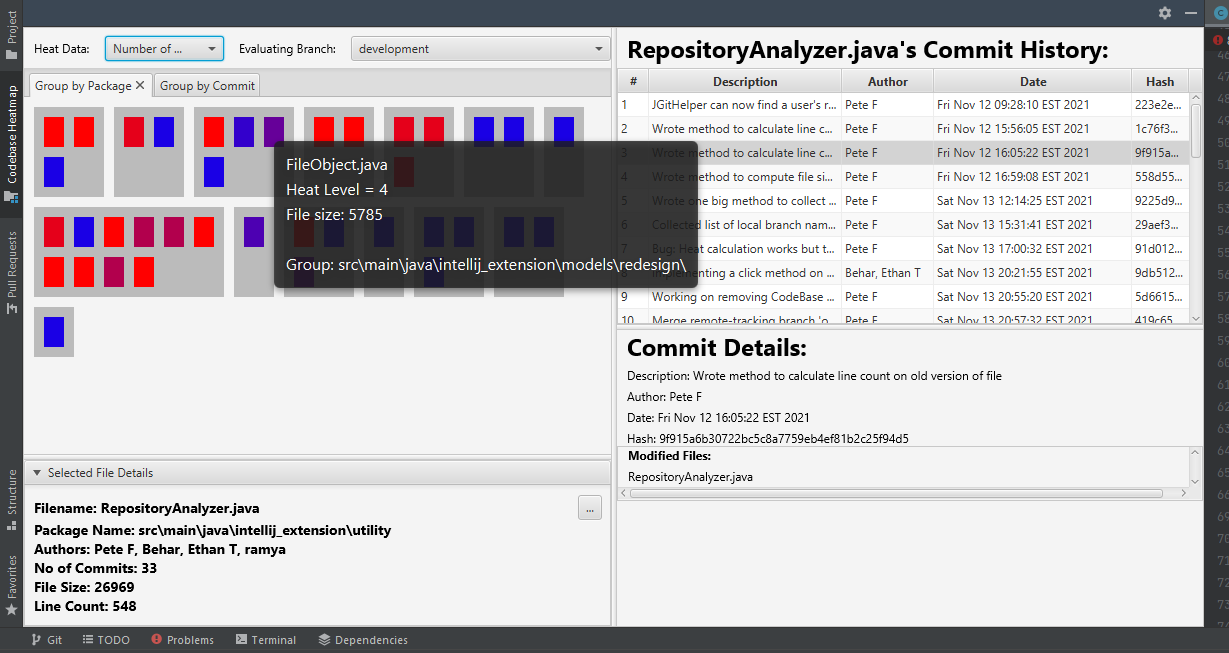
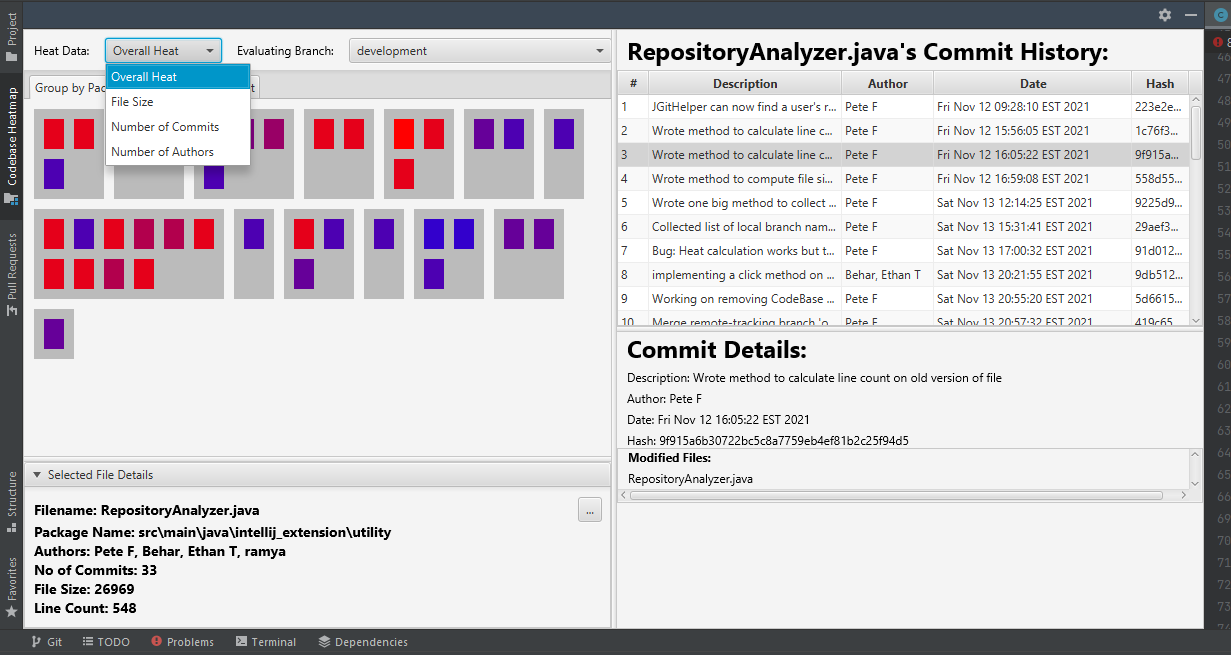
- Each file is given a heat color based on either:
- Number of commits
- Number of authors
- File size
- Overall (weighted total of all the above metrics)
- Selecting a branch lets one see if the code truly improved over time
- Files are grouped based on either:
- Their package
- Which files they appeared in the same commits with
- Shows every commit a file was modified in
- Shows a commit's modifications, additions, & deletions
Heat Map
Commit History
Commit Details
Tech Stack
Technologies
- Java
- Java FX
Tools
- GitHub
- JUnit
- Jira + Confluence
- SonarQube
Design Patterns Used
- Composite
- MVC
- Observer
- Singleton
- Strategy
View the VSCode Version
View Another Project